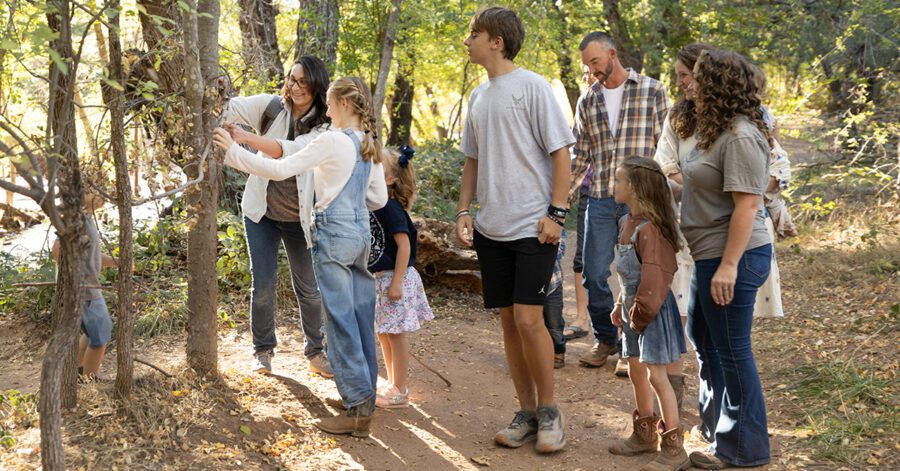
Science often begins with wonder: watching ants scurry across a sidewalk or sketching a flower in bloom. But as we move from the wonder of discovery, our classical learning skills help us build a deeper understanding of the world and its Creator.
That’s where data collection and analysis come in. These are not just tasks for lab coats and research grants; they are everyday habits we can cultivate at every level of learning. When we teach our students to attend carefully, record clearly, and analyze thoughtfully, we equip them to become lifelong learners who pursue truth.
Let’s explore how the classical learning skill of Attending forms the foundation for scientific data collection. We’ll walk through the steps of the scientific method—especially observation, recording, and analysis—and offer practical activities you can use from Foundations through Challenge.
Attending: A Classical Skill and Scientific Essential
In classical education, one of the 15 key learning skills is Attending—giving focused, respectful attention to something over time. This parallels the first step of the scientific method: observation. Students must observe carefully before they can hypothesize, test, or prove anything.
Before a child counts how many bees visit a flower, they first must notice that the bees are there. Before tracking how many seeds sprout, they need to watch the soil each day. Attending prepares the way for thoughtful data collection.
From Noticing to Notating: Building Data Literacy
Once a child has observed something, it’s time to record it. A vague memory of a buzzing bee is not the same as writing down, “Observed five bees on dandelions at 3:00 p.m., sunny weather.” Writing or sketching these observations reinforces accuracy, memory, and curiosity.
Recording data doesn’t require fancy equipment—just consistency. Students can:
- Make tally marks to count how many times they observe something
- Label photos or drawings with time, date, and conditions
- Keep a nature journal with notes, sketches, and labels
- Use tables or checklists to track findings
Next comes analysis. This might be as simple as asking:
- Which bird visited our feeder the most this week?
- Did more seeds sprout in the sun or the shade?
- What day had the most cloud cover?
Analysis teaches students to move from “What did I see?” to “What might it mean?” This develops critical thinking and builds confidence in interpreting real-world patterns. As students ask and answer these questions using the data they recorded, they begin to think scientifically—comparing, interpreting, and hypothesizing.
Scientific Method in Action: A Bee and a Flower
Let’s walk through a real example of the Scientific Method using bees:
- Observation: Bees seem to like certain flowers.
- Question: Do bees prefer dandelions or clover?
- Method: Each day at 10 AM, walk through the yard and photograph bees on flowers.
- Recording: Write the date, time, and flower species for each photo.
- Analysis: Count the number of bee visits per flower type over a week.
- Conclusion: Which flower had the most visits? Why might that be?
This kind of project helps students internalize the steps of the scientific method—and makes science feel alive and purposeful.
Foundations to Challenge: Data at Any Age
Foundations (ages 4–12)
- Nature walks: record weather, bugs, or plants with tally marks or counting
- Drawing journal: sketch and label leaves, insects, or clouds
- Oral reporting: describe what was seen in complete sentences
Essentials (ages 9–12)
- Create charts or graphs from recorded data
- Write summaries of observations
- Compare patterns over time (e.g., types of birds seen each week)
Challenge A–IV (ages 12–18)
- Conduct formal lab experiments and write lab reports: Challenge I-IV
- Use spreadsheets or graphing tools to interpret results: Science Fair in Challenge A
- Design and carry out independent research projects: Challenge A-I
Backyard Science Projects for Real Data Practice
Many citizen science projects invite homeschoolers to contribute real data to ongoing research. These are fantastic opportunities to teach the full scientific process.
| Project | Type of Data | Age Range | Website |
| Lost Ladybug Project | Species/location of ladybugs | All ages | lostladybug.org |
| Project Budburst | Plant life cycles | Elem–HS | neonscience.org |
| Firefly Watch | Firefly activity | All ages | fireflyatlas.org |
| Project FeederWatch | Birds at feeders | Elem–HS | birds.cornell.edu/pfw |
| Great Backyard Bird Count | Bird species by region | All ages | birdcount.org |
| Mushroom Observer | Fungi sightings | HS+ | mushroomobserver.org |
| Project Noah | Wildlife photos and notes | All ages | projectnoah.org |
Tools for Collecting and Analyzing Data
Whether you’re just starting or building a family research lab, here are simple tools to support your homeschool science efforts:
- Nature journals and sketchbooks
- Graph paper or printable data tables
- Clipboards and colored pencils
- Digital photos labeled with time and place
- Free apps or spreadsheets for older students
- Drawing techniques like OiLS to sketch accurate observations
Conclusion: Helping Students Ask and Answer
When homeschool students learn to record what they see and analyze what it means, they become more than science learners—they become investigators of truth. And when we train their eyes to attend and their hands to record, we’re preparing them to do more than pass a test—we’re teaching them to understand and steward the world around them.
Science is not just about facts. It’s about forming a habit of inquiry. So pick up a clipboard, sharpen your pencil, and go outside. There’s data waiting to be discovered.